- Marye
- 02 Jun, 2016
- Tech articles
Study and Analysis of ARender performances in ELK stack is now possible!
The ARender Rendition Server returns information on its usage, like the loading time of a document and the opened document type. This information is stored in a log file. It is possible to analyse these logs with the ELK stack.
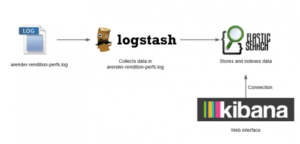
ELK stack is composed of three applications: Elasticsearch, Logstash and Kibana.
- Elasticsearch stores and indexes data. It is a NoSQL base allowing to manage big data.
- Logstash collects the log file, filters and sends data in Elasticsearch.
- Kibana is a Web interface allowing to search and visualize graphically data.
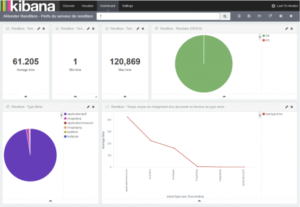
In Kibana, a dashboard is obtained with graphical information on the rendition performances.
On the below image, the first number is the average loading time to open a document. The others are the minimum and maximum loading time to open a document. The pie chart to the right displays the number of good (green) and bad (red) responses of the rendition. The other pie chart returns the number of opened documents by document type. Finally, the line chart represents the average loading time by document type.
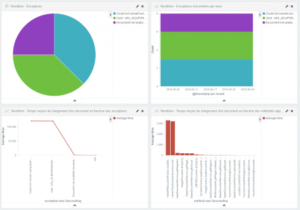
On the below image, the two first charts analyse the different exceptions met by the rendition. The line chart displays the average loading time in terms of these exceptions. Finally, the last bar vertical chart presents the average loading time by Java methods.
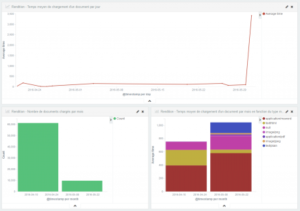
Finally, on the last image, the line chart displays the average loading time by day. The first vertical bar chart is the number of loaded documents by month. And the last, presents the average loading time by month in terms of document type.
Installation/configuration instructions
Prerequisites
To install the ELK stack, it is necessary to have at least Java 7 installed. To check the Java version, open a shell prompt and enter java -version. If the version of Java is less than 7, install a new version.
Verify that the JAVA_HOME environment variable is available in the environment variables:
- On Linux : echo $ JAVA_HOME
- On Windows : Control Panel \ System and Security \ System, click Advanced System Settings and Environment Variables
If JAVA_HOME is not available add it:
- On Linux: export JAVA_HOME = { path to java }
- On Windows : New System Variable
- Variable name : JAVA_HOME
- Variable value : { path to java }
Elasticsearch
Installation on Linux (Centos or Redhat)
Open a shell prompt and enter the following commands:
- cd /opt/
- sudo mkdir ELK
- cd ELK
- sudo wget
https://download.Elasticsearch.org/Elasticsearch/release/org/Elasticsearch/dist ribution/rpm/Elasticsearch/{Version}/Elasticsearch-{Version}.rpm - sudo yum localinstall Elasticsearch-{Version}.rpm
- cd /etc/Elasticsearch
- sudo emacs Elasticsearch.yml
- Modify the line cluster.name : arender-cluster (No uppercase in the cluster name)
- Network.host : [Adresse IP de la VM] if Elasticsearch is installed on a VM
- sudo service Elasticsearch start
Installation on Windows
Download the zip file on: https://www.elastic.co/downloads/elasticsearch.
Unzip the folder to the chosen folder, for example C:\Users\ {name}.
Open Elasticsearch.yml file located in .\elasticsearch-{Version}\config\ with a text editor like Notepad++. Modify the following lines:
- cluster.name: arender-cluster
- Network.host: [address IP of virtual machine] if Elasticsearch is installed on a virtual machine
Save the modifications.
To install Elasticsearch as service, open a shell prompt and enter:
- cd C:\Users**{nom}**\Elasticsearch-{Version}\bin
- service.bat install
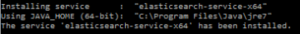
Elasticsearch is now installed as service. To start it, open the services application of Windows. Select Elasticsearch service and click on start.
Plugin head-Elasticsearch
The plugin head is an interface for Elasticsearch. To install on Linux, open a shell prompt and enter sudo Elasticsearch-{Version}/bin/plugin install mobz/Elasticsearch-head.
For Windows, the plugin is available in zip file on: https://github.com/mobz/elasticsearch-head.
Unzip the folder in ./Elasticsearch-{Version}/plugins. And rename the folder by “head”.
Restart Elasticsearch. The plugin head-Elasticsearch is available at this URL: {host}:9200/_plugin/head.
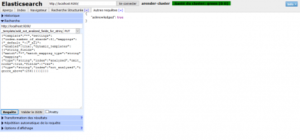
Elasticsearch template
It is possible to add templates in Elasticsearch. In the following template, fields of string type not analysed finishing by .raw are created from fields of string type analysed. The fields of string type can be used without its cut after a space.
Add a template from “Any Request” tab of head-Elasticsearch plugin.
http**_:_**//**_{host}_**:9200/
template/{_name_of_template} PUT
{
“template”:"*",
“settings”:{
“index.number_of_shards”**:**5
},
“mappings”:{
“_default_":{
“_all”:{“enabled”:true},
“dynamic_templates”:[{
“string_fields”:{
“match”:"*",
“match_mapping_type”:“string”,
“mapping”:{
“type”:“string”,
“index”:“analyzed”,
“omit_norms”:true,
“fields”:{
“raw”:{
“type”:“string”,
“index”:“not_analyzed”,
“ignore_above”**:**256
}
}
}
}
}]
}
}
}
Logstash
Installation on Linux
Open a shell prompt and enter:
- cd /opt/ELK
- sudo wget https://download.elastic.co/logstash/logstash/packages/centos/logstash-{Version}-1.noarch.rpm
- sudo yum localinstall logstash-{Version}-1.noarch.rpm
Installation on Windows
Download the zip file on: https://www.elastic.co/downloads/logstash.
Unzip the folder to the chosen folder, for example C:\Users\ {name}.
Logstash configuration file
Create a file of configuration myfile.conf, with a text editor like Notepad++, in the folder: ./logstash-{Version}/bin.
This file is composed in three parts:
- An “input” part to define the enter points. For example, the paths to read the log file.
- A “filter” part where Logstash read the log file line by line and apply a filter to extract data.
- A “output” part to define the exit points. Here, it is Elasticsearch.
myfile.conf
input {

file {

path => « **_{Path to the log file}_** »

type => « syslog »

start_position => « beginning »

}

}

filter {

\# Grok cut the field « message » into several fields

\# Attention, for the **inferior**** versions at 3.0.6** the specific spaces

\# are not the same,

\# chose **SEPARATORSPE** for **Linux**

\# and **SEPARATORESP** for **Windows**

\# For the versions **equals or superior at the 3.0.6** **version**

\# chose **SEPARATOR** and add a space after right brace

grok{

match => {

\# "message" => "…" must be on only one line

"message" => "%{NAME}%{TIMESTAMP\_ISO8601:dateStart} %{SEPARATOR} %{NAMEEND}%{TIMESTAMP\_ISO8601:dateEnd} %{SEPARATOR} %{NAME}%{BASE10NUM:time}%{USERNAME:unite} %{SEPARATOR} %{NAME}%{METHOD:method} %{SEPARATOR} %{NAME}%{MIMETYPE:mimeType} %{**SEPARATORSPE**}%{NAME}%{DOCID:documentId} %{**SEPARATORSPE**}%{NAME}%{USERNAME:result} %{SEPARATOR} %{NAME}%{EXCEPTION:exception} %{**SEPARATORSPE**}%{NAME}%{GREEDYDATA:args}"}

\# patterns_dir give the path of file, pattern.conf

\# This file regroup regex of each new field

patterns_dir => ["**_{path to the file pattern.conf}_**_"]_

}

\# date change the type of a field in date

date {

locale => "fr"

match => ["dateStart", "YYYY-MM-dd HH:mm:ss,SSS"]

target => "@timestamp"

}

\# mutate convert the type of a field

mutate {

convert => { "time" => "integer" }

}

}

output {

elasticsearch {

hosts => ["**{host}**:9200"]

action => "index"

\# The index name must not have uppercase

index => "rendition-perfs"

}

stdout { codec => rubydebug }

}
pattern.conf
NAME [a-zA-Z]*=

NAMEEND [a-zA-Z]*\s=

SEPARATOR \|\|

METHOD \[a-zA-Z\]\[^\|\]*

MIMETYPE \[a-zA-Z\]\[^\|\]*

DOCID \[a-zA-Z\]\[^\|\]*

EXCEPTION .*[^|]

\# Version of specific separator for Windows

SEPARATORESP \|\|

\# Version of specific separator for Linux

SEPARATORSPEC \|\|Â\\xA0

NAMEREQUEST [a-zA-Z\/?=]*

LOADINGTIME [0-9]*

SEPARATORAND &

NAMEVERSION [a-zA-Z=]*

VERSION [0-9a-zA-Z.-]*
To launch Logstash, open a shell prompt and enter: ./logstash-{Version}/bin/logstash –f myfile.conf
Kibana
Installation on Linux
Open a shell prompt and enter:
- cd /opt/ELK
- sudo wget https://download.elastic.co/kibana/kibana/kibana-{Version}-linux-x64.tar.gz
- sudo tar xzvf kibana-{Version}-linux-x64.tar.gz
- cd kibana-{Version}-linux-x64/config
- sudo emacs kibana.yml configure the address of Elasticsearch
To launch Kibana: nohup /opt/ELK/kibana-{Version}-linux-x64/bin/kibana &
Installation on Windows
Download zip file on https://www.elastic.co/downloads/kibana.
Unzip the folder, for example in C:\Users\ {name}\
In the folder .\Kibana\config\kibana.yml, configure the address of Elasticsearch.
To launch Kibana, click on kibana.bat.
Add an index
To add an index in Kibana, open the URL {host} :5601. In Settings > Indices tab, shoot “index contains time-based events”. Enter the name of the Elasticsearch index and click on “Create”.

Add dashboard
In Settings > Objects tab click on “Import”. Click on the visualizations file (visualisations_rendition.json) and restart with the dashboard file (rendition.json).

In the “Dashboard” tab, click on “Load Saved Dashboard” and click on the dashboard name.